10. Results If applicable, the effect size with a confidence interval. examples
For each experiment conducted, including independent replications, report:
Example 1
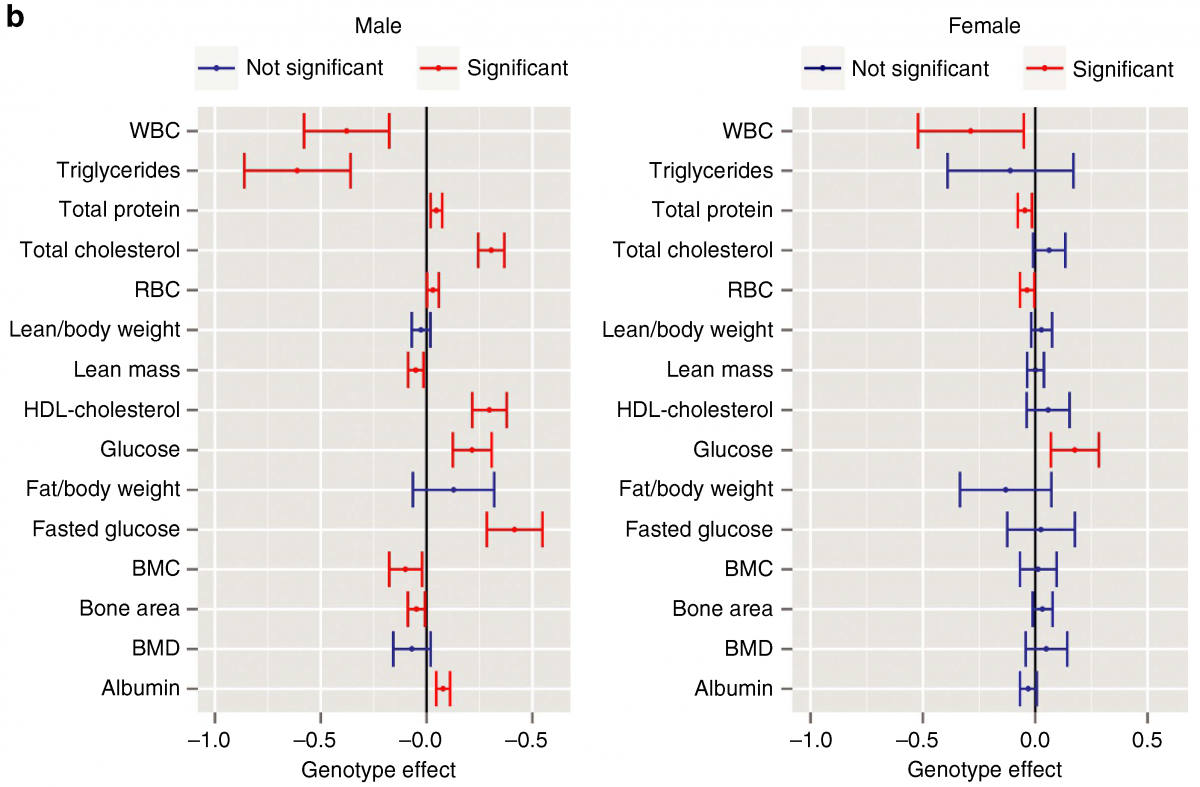
“For all traits identified as having a significant genotype effect for the Usp47tm1b(EUCOMM)Wtsi line (MGI:5605792), a comparison is presented of the standardized genotype effect with 95% confidence interval for each sex with no multiple comparisons correction. Standardization, to allow comparison across variables, was achieved by dividing the genotype estimate by the signal seen in the wildtype population. Shown in red are statistically significant estimates. RBC: red blood cells; BMC: bone mineral content; BMD: bone mineral density; WBC: white blood cells.” [1]
Karp NA, Mason J, Beaudet AL, Benjamini Y, Bower L, Braun RE, Brown SDM, Chesler EJ, Dickinson ME, Flenniken AM, Fuchs H, Angelis MHd, Gao X, Guo S, Greenaway S, Heller R, Herault Y, Justice MJ, Kurbatova N, Lelliott CJ, Lloyd KCK, Mallon A-M, Mank JE, Masuya H, McKerlie C, Meehan TF, Mott RF, Murray SA, Parkinson H, Ramirez-Solis R, et al. (2017). Prevalence of sexual dimorphism in mammalian phenotypic traits. Nature communications. doi: 10.1038/ncomms15475